How much does science really know, anyway?
An older issue of EOS, the weekly newspaper of the American Geophysical Union, has a very compact but informative figure in it that is very relevant today:
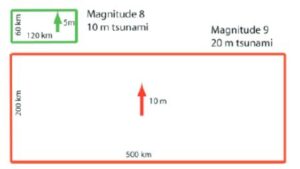
This shows the relation between fault surface that tears and moment magnitude of the ensuing earthquake (from Stein & Okal, 2011, https://agupubs.onlinelibrary.wiley.com/doi/epdf/10.1029/2011EO270005). It helps the average science-interested individual figure out how the size of a fault-plane can tell you how big an earthquake COULD be. Really? Other elements of the figure also warn us of potentially how large a tsunami run-up (the wall of water you will meet at the coast shortly afterwards) might* follow one of these monsters. The follow-on tsunami is what killed most of the ~16,000 people who died in northeast Japan in March 2011. (Elliott, 2014). The tsunami, not the magnitude ~8+ Aceh earthquake, is also what killed about 250,000 people around the borders of the Indian Ocean in December 2004. (Satake and Atwater, 2007).
It’s been known for a long time that the size of an earthquake correlates fairly well with how much surface area is torn in the formerly “stuck” rocks on a fault surface.
Some quick brittle-rock-vs-plastic-rock basics:
If you have a vertically-oriented fault like the San Andreas, the vertical dimension for the fault “tear” can be only about 10 kilometers – below that depth the rock is so hot and pressurized that it turns plastic and doesn’t “break.” A magnitude 7.8 event is about as big as it can get for the San Andreas Fault. Even if it rips horizontally for 200 kilometers, it can’t get enough surface area torn to have a magnitude bigger than that.
An ocean-floor subduction fault, however, is a different kind of cat. These faults dip shallowly, almost flat in some places. You can therefore get a lot more “down-dip” rock breakage or “tear” in that direction with this kind of fault before the down-going slab of oceanic crust gets down to the “plastic” zone.
The Tohoku earthquake off northeast Japan in March 2011 was calculated to have been in the magnitude 9+ range. That’s 10 times more energy released than a magnitude 8 event, and close to 25 times more energy than a “piddly” San Andreas 7.8 event (the earthquake that destroyed San Francisco in 1906).
The EOS diagram above lays out this surface-slip calculation pair:
A 60 km by 120 km tear, with 5 meters slip along the fault-face, will give you a magnitude 8 event – and a 10-meter tsunami run-up. That’s a wave – a wall of water – nearly 35 feet high.
A 200 km by 500 km rip, with 10 meters slip (the Tohoku earthquake), will give you a magnitude 9 event – and a tsunami run-up of up to 20 meters (a 65-foot wave).
This latter explains the monster 15-meter (50-foot) wall of water that hit and destroyed the Fukushima Dai-Ichi nuclear plant, and over-ran and destroyed villages many kilometers inland. This Fukushima nuclear plant debacle now looks more and more like the Chernobyl disaster that depopulated much of the Ukraine in 1986 (where about 135,000 people were permanently evacuated from their homes in a little over a day).
It’s been known for a long time that the rate of subduction – how fast a continent is over-riding an oceanic floor – seems to correlate with the frequency of volcanic eruptions inside the continent’s edge. Mount St Helens has erupted twice since 1980 (but no other eruptions have occurred elsewhere in the Cascade Range since 1917’s Lassen Peak event in northern California). The Juan de Fuca plate “only” moves about 2.5 cm (1 inch) per year towards North America, slow compared to 8 cm per year, the rate at which the Kamchatka Peninsula is moving eastward over the Pacific plate.
More oceanic floor plate thus gets subducted down to the mantle, faster, and this means more partial melting takes place, faster. Think of a lava-lamp with three times the heating coils all turned on at once.
What are subduction-related volcanoes, anyway? Examples are Mount Rainier on Seattle’s skyline, Mount St Helens and Mount Hood near Portland, and Mount Shasta in Northern California: in fact, the whole Cascades range qualifies. Their equivalents elsewhere: Bezymiani, Sheveluch, Alaid and a boatload of other dangerous volcanoes in Russia’s far east Kamchatka Peninsula; Mt. Fuji and Mt. Unzen in Japan; Mt. Pinatubo in the Philippines; and Krakatau (“east of Java”) and Merapi in Indonesia. There’s a reason why the Pacific Rim is called the “Ring of Fire.” More pointedly, all the volcanoes in Central and South America are subduction-related volcanoes (see the previous chapter, “Volcanoes and Nephi’s Smoking Gun”).
Does this subduction rate thing also hold for the frequency of occurrence for large earthquakes?
The same diagram in the article suggests that subduction earthquake frequency and size don’t seem to correlate with how fast the plates are moving. This is probably because of complex fault geometries, and how often so-called “silent” or “slow” earthquakes take place (some tend to quietly redistribute accumulating fault strain… and apparently occur frequently beneath the Pacific Cascades).
The bottom line here: the last huge subduction earthquake on the Pacific Northwest coast happened in January 1700 AD (Atwater 2005; 2015). According to seafloor drill cores, at least 7 of these magnitude 8+ events have occurred in the last 3,500 years, but that means nothing in terms of predicting the next monster. There is no regularity to these things. They don’t “tick” like a clock. The Next Big One could occur tomorrow or 400 years from now.
What can you do about this? If you live in Kansas, you need not worry. Well, maybe you still do – because of tornadoes.
If you live in Portland or Seattle (or Tennessee, Arkansas, South Carolina, or Missouri where there have been large earthquakes in the past), however, it would be a good idea to earthquake-reinforce your house – and buy earthquake insurance. The problem is that if a Cascadia earthquake hits in the Pacific Northwest, the damage could be so massive and so far-reaching that it could wipe out many North American insurance companies. Hurricane Andrew (which slammed into south Florida in 1986, the same year as Chernobyl blew up in the Ukraine) caused about $24 billion in damage, and even with the modern practice of spreading risk by underwriting, it stretched some insurance company reserves to their limits.
You CAN, however, steadily build up toward a year’s supply of food, and develop some sort of water storage system. Again, this is as much for your neighbors as for yourself. You are your brother’s keeper. You could restate it this way: Who would Jesus expect you to save? This is yet another way that science can inform our future. If we study, and are thoughtful and Christ-like, we really need not fear that future.
* Depending on fault geometry, there could also possibly be only a small tsunami – for instance a left-lateral or right-lateral fault movement would not raise or lower the seabed significantly, so it would not create a tsunami. Knowing the fault geometry ahead of time thus makes a big difference in predicting the size of a possible tsunami, when the first seismic waves at a seafloor earthquake sensor reports back to the Pacific Tsunami Warning Center in Hawai’i and the hypocenter is located.